var_map <- c(
"volkja_proz" = "Popular Vote % (volkja_proz)",
"ktjaproz" = "Cantonal Vote % (ktjaproz)",
"annahme" = "Outcome (annahme)",
"inserate_total" = "Total Ads Volume (inserate_total)",
"inserate_jaanteil" = "Share of 'Yes' Ads (inserate_jaanteil)",
"mediaton_tot" = "Media Tone (mediaton_tot)",
"bet" = "Voter Turnout (bet)",
"nrja" = "National Council Yes (nrja)",
"nrnein" = "National Council No (nrnein)",
"d1e1" = "Policy Domain (d1e1)",
"rechtsform" = "Legal Form (rechtsform)",
"sammelfrist" = "Collection Deadline (sammelfrist)",
"dat_start" = "Start Date (dat_start)",
"dat_submit" = "Submission Date (dat_submit)"
)
missing_data <- votes |>
select(year, all_of(names(var_map))) |>
mutate(across(all_of(names(var_map)), ~ case_when(
as.character(.) %in% c(".", "", "9999") ~ NA_character_,
is.na(.) ~ NA_character_,
TRUE ~ as.character(.)
))) |>
pivot_longer(
cols = -year,
names_to = "code",
values_to = "value"
) |>
mutate(
is_missing = is.na(value),
variable_label = recode(code, !!!var_map)
)
missing_summary <- missing_data |>
group_by(variable_label) |>
summarize(
pct_missing = mean(is_missing),
count_missing = sum(is_missing)
) |>
arrange(pct_missing)
ordered_levels <- missing_summary$variable_label
missing_summary <- missing_summary |>
mutate(variable_label = factor(variable_label, levels = ordered_levels))
heatmap_data <- missing_data |>
mutate(decade = floor(year / 10) * 10) |>
group_by(decade, variable_label) |>
summarize(pct_missing = mean(is_missing), .groups = "drop") |>
complete(decade = seq(from = 1840, to = 2020, by = 10), variable_label) |>
mutate(variable_label = factor(variable_label, levels = ordered_levels))
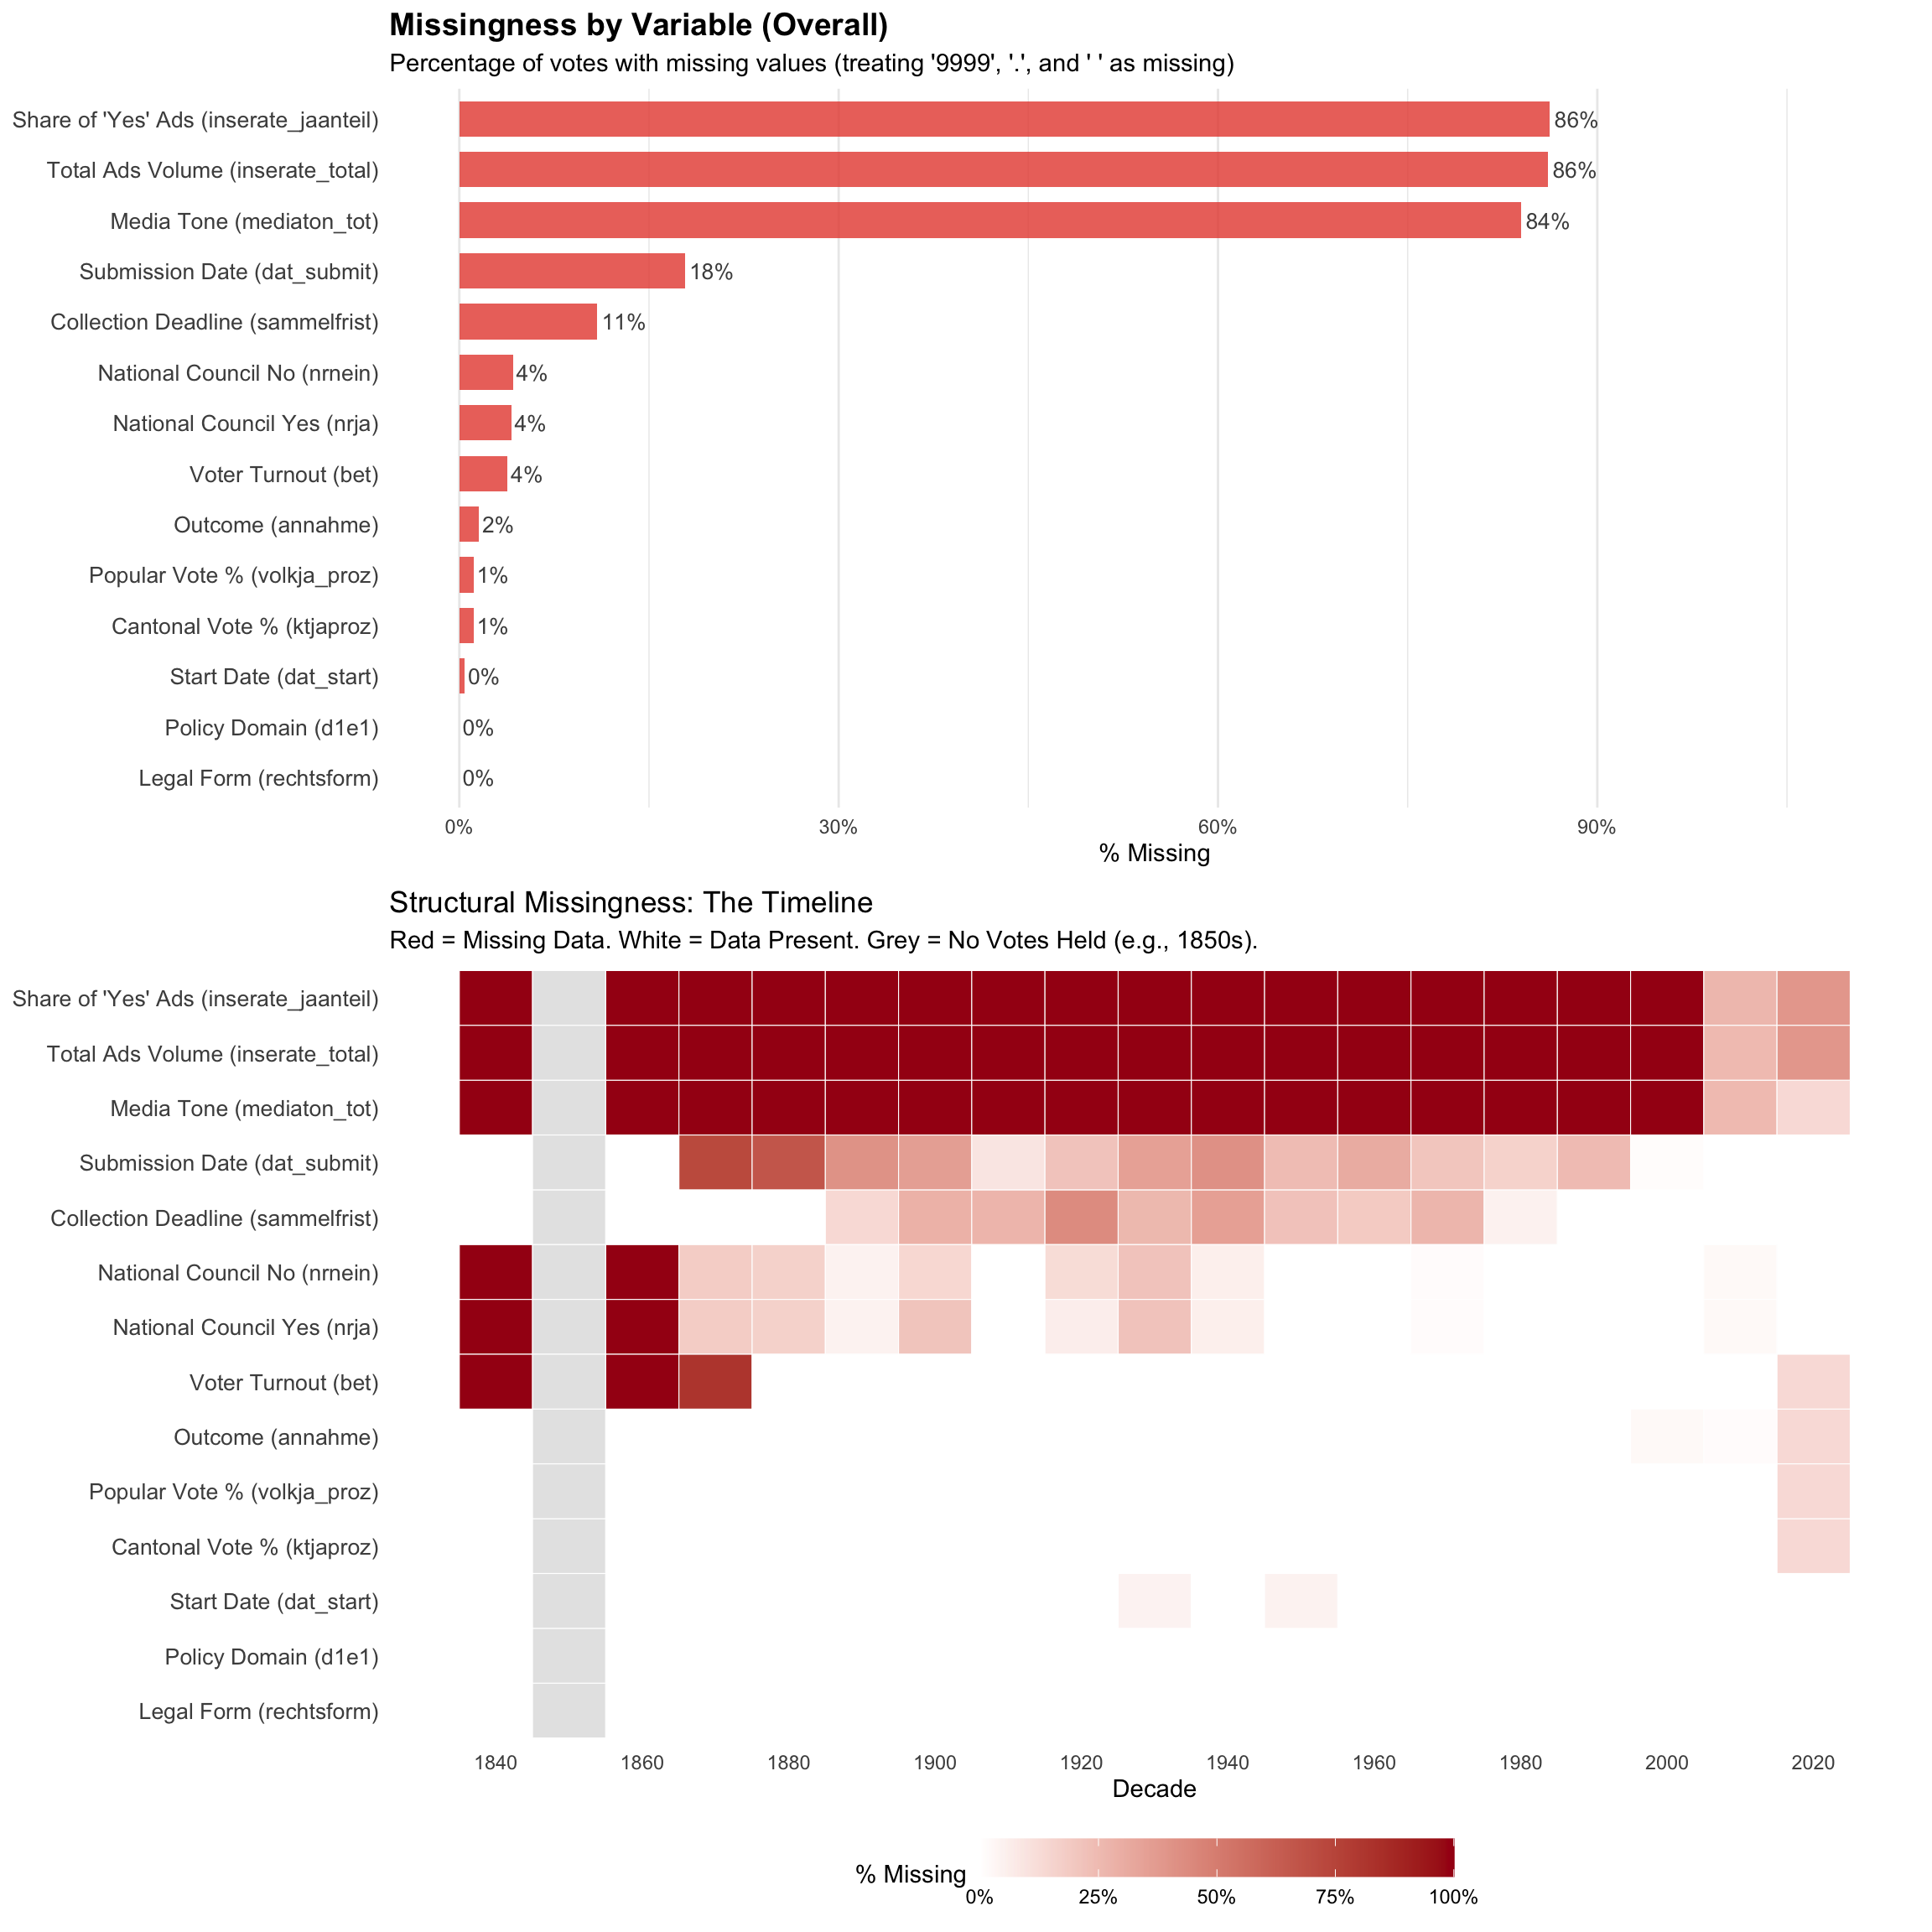
p1 <- ggplot(missing_summary, aes(x = pct_missing, y = variable_label)) +
geom_bar(stat = "identity", fill = "#E74C3C", alpha = 0.8, width = 0.7) +
geom_text(aes(label = percent(pct_missing, accuracy = 1)),
hjust = -0.1, size = 3.5, color = "grey30") +
scale_x_continuous(labels = percent_format(), limits = c(0, 1.1)) +
labs(
title = "Missingness by Variable (Overall)",
subtitle = "Percentage of votes with missing values (treating '9999', '.', and ' ' as missing)",
x = "% Missing",
y = NULL
) +
theme_minimal() +
theme(
plot.title = element_text(face = "bold", size = 14),
panel.grid.major.y = element_blank(),
axis.text.y = element_text(size = 10)
)
p2 <- ggplot(heatmap_data, aes(x = decade, y = variable_label, fill = pct_missing)) +
geom_tile(color = "white", size = 0.2) +
scale_fill_gradient(
low = "white",
high = "#a50f15",
na.value = "grey90",
labels = percent_format(),
name = "% Missing"
) +
scale_x_continuous(breaks = seq(1840, 2020, by = 20)) +
labs(
title = "Structural Missingness: The Timeline",
subtitle = "Red = Missing Data. White = Data Present. Grey = No Votes Held (e.g., 1850s).",
x = "Decade",
y = NULL
) +
theme_minimal() +
theme(
legend.position = "bottom",
legend.key.width = unit(1.5, "cm"),
panel.grid = element_blank(),
axis.text.y = element_text(size = 10)
)
grid.arrange(p1, p2, nrow = 2, heights = c(1, 1.2))